For the past two years, I’ve been working with a team on an extensive research project. We’ve been analyzing data from the past decade in the United Methodist Church in Kentucky. One of our most interesting studies was on the effects of pastoral tenure and transition. I’ve summarized some of our findings in this white paper, “Tenure and Transition in the Kentucky United Methodist Church.” You can see the PDF here (may be easier to read and share) or see it in full below.
Methodology sections may be more technical than you care for. If the Results sections are clear enough to you, you may prefer to skip over the Methodology sections.
I hope to publish more from our study in the coming months. If you’d like to be sure you see those, click here to subscribe for my blog updates. I’d be happy to have more conversation or respond to questions. Contact me by email here.
In 2016, the Kentucky Annual Conference (KAC) commissioned a Stats Team[1] to conduct data analysis. Our mandate was broad: analyze the data for anything that would assist the Annual Conference in its future planning and goal-setting. This report summarizes our team’s findings regarding pastoral tenure and transition in the Kentucky Annual Conference––one portion of our larger study.
Recommendations at the end of this report are my own and do not necessarily represent the opinions of the Annual Conference or Conference Stats Team.
Study #1 – Worship Attendance Change & Year of Appointment
Question: How does reported average worship attendance increase or decrease during each year of a pastor’s appointment to a congregation?
Methodology
We studied all churches with an average worship attendance (AWA) of 150 or more as of 2005, a total of 80 churches. Study period was for 2005 – 2015.[2]
We recorded AWA change for each year of a pastor’s appointment at a church. The year of a transition from one senior pastor to another was considered a “transition” year. The first full calendar year of a senior pastor’s appointment was year 1, etc.[3]
Results
Change in worship attendance during each year of a pastor’s tenure
The chart and table below show the change in average worship attendance during each year of a pastor’s tenure.
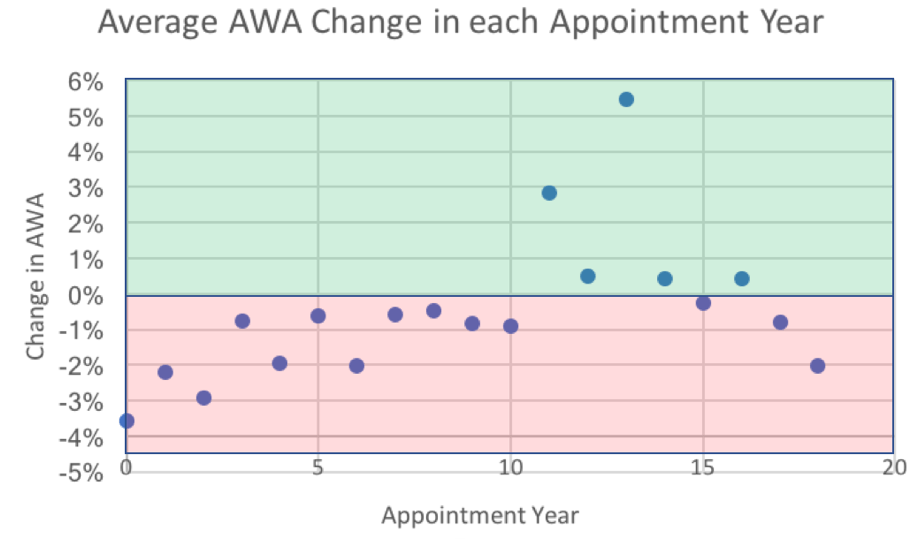


In the table at left, N represents total number of observations for each data point (i.e. pastors observed in their ___th appointment year).
As number of observations decrease, so does our data reliability. Years 14 – 18 reflect 5 or less data points and so may not be reliable indicators.
As you can see from this chart and table, as pastoral tenure increases, so does the change in average worship attendance. The transition year and early years of a pastor’s tenure are the most likely years of attendance decline.
In total, attendance losses during Transition years represent more than 1/3 of the Kentucky Annual Conference’s total attendance decline for 2005 – 2015.

Losses during Transition year and year 1 represent more than 1/2 of the Conference’s total loss.

And losses during Transition through Year 2 represent more than 2/3 of the Conference’s total loss.

Percentage of growing churches
The chart below shows the percentage of churches that grew during each year of a pastor’s tenure. Upward trend line shows increasing likelihood of growth during later years of tenure. The first year where 50% of churches grew was not until year 7.
 Survivorship Bias
We also researched survivorship bias. Is it possible that these numbers are skewed because pastors receive longer appointments when their churches grow in worship attendance, while pastors are more likely to be moved when their churches decline in worship attendance?
Findings:
• Pastors who receive a 3rd year[4] lost 6.5% in transition through year 2 (compared to 8.5% average loss)
• Pastors who receive a 5th year lost 4.8% in transition through year 4 (compared to 10.9% average loss)
Pastors with longer tenures had slightly better results in transition through year 2 and significantly better results in transition through year 4. Though their declines were less, even those pastors receiving a 5th year of appointment averaged a decline in AWA in their first 4 years.
Conclusion
The Kentucky Annual Conference has shown a clear and consistent trend for worship attendance losses in transition and early years of a senior pastor’s ministry, even for pastors who later see growth in worship attendance. As a pastor’s tenure grows longer, worship attendance change improves.
Study #2 – Worship Attendance Change & Pre-Transition Growth or Decline
Question: Are transitions preserving momentum (positive and negative) or reversing it?
Methodology
We studied all churches with average worship attendance of 150 or more as of 2005, a total of 80 churches.[5] Study period was for 2005 – 2015. In total, we observed 119 transitions.
For all transitions of a senior pastor during this period, we measured the church’s pre-transition worship attendance change and post-transition worship attendance change.
Worship attendance change for a pastor was measured as attendance in pastor’s last full year / attendance in previous pastor’s last full year. For example, if a pastor had worship attendance of 200 in their last year of appointment (before transition year) and the previous pastor had 180 in their last year of appointment, that pastor’s worship attendance change would be 200 / 180 = +11%.
Four categories for each pastor’s tenure at a church:
- Big gain: 10%+ AWA increase
- Small gain: <10% AWA increase
- Small loss: <10% AWA decrease
- Big loss: 10%+ AWA decrease
In the sample church below, the previous pastor experienced a 14% increase in AWA from 2005 – 2008, a big gain. The church received a new pastor in 2009. Comparing 2015 to the previous pastor’s last full year (2008), the church has declined in AWA by 21%, a big loss.

Results
Types of Transition
How were the studied churches doing prior to transition?

The most common pastoral transition came after a big loss.
51% of all transitions observed came after a loss in AWA while 49% came after a gain.
How did the studied churches do after transition?

Half of all churches experienced a big loss after transition.
69% of all post-transition churches declined in AWA.
What happens after a big loss?

We are reversing bad momentum into gains in 43% of post-transition churches (28% big gains, 15% small gains). Almost as many churches continue to have big losses with their next senior pastor, with 40% suffering another big loss.
Compared to all churches, a church that has experienced a big loss is much more likely to experience big gains and less likely to continue experiencing a big loss with its next pastor. Nevertheless, they are more likely to continue declining than to reverse their decline.
Average change for a church transitioning after a BIG LOSS: further loss of 5.3% AWA.
What happens after a small loss?

Pastoral transitions after a small loss led to a further loss in 78% of churches. Most experienced a big loss with their next senior pastor.
Average change for a church transitioning after a small loss: further loss of 7.3% AWA.
What happens after a small gain? 
Pastoral transitions after small gains led to a loss in 69% of churches. Nearly half of all churches transitioning after a small gain suffered a big loss.
Average change for a church transitioning after a small gain: loss of 6.2% AWA.
What happens after a big gain?

Churches that had big gains under one pastor have shown no tendency to continue those gains with new leadership. We are effectively reversing good momentum into losses in 90% of post-transition churches.
Churches that experienced a big gain with their previous pastor are the most likely category to experience a big loss after transition.
Average change for a church transitioning after a BIG GAIN: loss of 10.6% AWA.
In one instance, a church followed a big gain with another big gain. What can we learn from this exception?
The church below had a transition year in 2011 after growing from 154 to 171 (11% gain). They had another transition the next year and grew again, to 209 (a 22% gain). This was the one instance of a BIG GAIN following a BIG GAIN.

However, the church had a third consecutive year of pastoral transition. After that transition, their AWA has declined to 55. One big loss in transition erased all previous gains and resulted in a total 64% attendance loss over the past decade.
 In total, 76% of all growing churches declined after a pastoral transition, while only 24% continued to grow.
Conclusion
Pastoral transitions in the Kentucky Annual Conference tend to be reversing good momentum and preserving bad momentum. 62% of declining churches continued to decline after transition. 76% of growing churches stopped growing and declined after transition.
Despite attempts at strategic appointment-making, new appointments have rarely been helpful to change negative momentum in declining churches, and they have been consistently detrimental to growing churches.
Churches that have suffered a BIG LOSS under their previous pastor are most likely to benefit from a transition. They have, by far, the greatest odds of growth after a transition. But even these have greater odds of further decline, with 57% continuing to decline and an average loss of 5.3%.
Study #3 – District Worship Attendance Change & Average Pastoral Tenure
Question: Are longer pastoral tenures in a district related to worship attendance changes in that district?
Methodology
We calculated the average years of pastoral tenure for all Full Elders in each KAC district, as of 2016.[6] We then compared the average pastoral tenure, as of 2016, to worship attendance change in each district from 2005-2015.
Results
Districts across the KAC show very different patterns for how long elders remain in an appointment, ranging from an average current tenure of only 3 years in Southeast District to 8.4 years in South Central District.
Average pastoral tenure has a significant correlation with worship attendance changes in our districts (0.54).
A significant correlation between average pastoral tenure and worship attendance change across districts is one of the few significant correlations to worship attendance change that our research has produced.
 We acknowledge that correlation does not imply causation. Other factors could be affecting both pastoral tenure and worship attendance change in these districts. It is possible that better worship attendance numbers have led to longer pastoral tenures in some places. Further regression analyses could provide more insights. Given how few variables we found that showed a relationship to worship attendance change, this relationship is worthy of attention.
Conclusion
Preliminary research demonstrates that districts with longer-tenured pastors have experienced better results in worship attendance change than districts with shorter average tenures. This question merits further research and is not yet conclusive.
Study #4 – Worship Attendance Change Over Tenures of 10+ Years
Question: How does reported average worship attendance change in churches whose pastors have 10+ years of tenure?
Methodology
This study examined worship attendance changes from 2005–2016 for all churches with a pastor serving in his/her 10th or more year of appointment as of 2016 Annual Conference Journal.
Results
118 pastors were serving in their 10th+ year of appointment as lead pastor of a congregation, as of July 2016.[7] These churches showed a significant difference from churches whose pastors had served less than 10 years.
Churches whose pastors served 10+ years had experienced a 1% average worship attendance loss in the previous decade. Those with shorter pastoral tenures experience an 18% loss during the same period.

Other analyses reveal the difference between churches with full-time pastoral appointments and part-time appointments over a 10+ year tenure:

The difference between pastors serving multi-point charges and those serving a single charge over 10+ years:
 And the difference between various classifications of pastors serving these appointments:

Conclusion
The most important finding from this study is the significant difference between churches whose pastors have a 10+ year tenure (1% worship attendance decline) and those with shorter tenures (18% worship attendance decline). This is likely a two-way relationship, as better worship attendance results may make it more likely for a pastor to stay at his/her current appointment.
These results also confirm other studies that suggest multi-point charges suffer worse worship attendance losses than comparable single charges.
Charges with full-time pastors performed marginally better than those with part-time pastors, and charges with non-retired pastors performed significantly better than those with retired pastors. With retired pastors removed from this study, churches whose pastors have a tenure of 10+ years showed a small gain in worship attendance.
Study #5 – Professions of Faith & Pastoral Transition
Question: How does the number of pastoral transitions affect a local church’s professions of faith?
Methodology
This study was conducted by Greg Survant of SLI, Inc.,, so it covers a different study period: 2008 – 2013.
The study categorizes churches according to how many senior pastors they had during the study period: 1 pastor, 2, 3, or 4+. It compares each category based on annual professions of faith / 100 AWA.[8]
Results
The average rate of annual professions of faith across all churches was 3.7 professions per 100 AWA.
Best-performing churches had only 1 pastor during the study period. For each new pastoral transition, professions of faith decreased.

The study then categorized churches according to size. In every size category, churches with fewer pastoral transitions had higher rates of profession of faith.

Results remain consistent across multiple segments, suggesting that this is a significant relationship. The more pastoral transitions a church has, the fewer professions of faith.
Conclusion
A local church’s professions of faith show a direct relationship to pastoral transitions. Higher frequency of pastoral transition correlates with fewer professions of faith.
Recommendations
The United Methodist Church is committed to an open itineracy. However, current practice does not reflect the past reality of Methodist itineracy, when Methodist preachers constantly traveled from town to town and were more often appointed to areas than single congregations. Current average tenures of 5 years suggest that we no longer equate itineracy with constant movement. Instead, our practice of open itineracy relates to two other values of the historic Methodist movement:
- Elders are committed to go and serve wherever their bishops send them.
- This commitment to itinerant ministry helps us meet the pastoral needs of congregations by allowing the bishop to send pastors where they are most needed.
The itinerant system is a means of meeting the pastoral needs of congregations. Results of this study suggest that we should further separate the concept of “itineracy” from the practice of constant movement. Results suggest that the pastoral needs of congregations and their communities are best met with deeper, longer-lasting pastoral relationships.
The United Methodist Church of the 21st century should focus on longer pastoral tenures and fewer pastoral transitions. Short pastoral tenures and frequent transitions are harming local congregations.
Many United Methodists have cited the increasing number of retirements as a problem. Retirements force transition. Due to this and other unforeseen factors, we should begin by focusing on increasing average tenure. This focus will lead to fewer transitions over time.
Bishop Al Gwinn, former residing Bishop of the North Carolina Annual Conference, notes a goal set by his Conference to increase the average pastoral tenure to 10 years. To meet that goal, the Conference planned for many pastors to serve well over 10 years to balance unexpected short tenures. When they appointed pastors to a new charge, they appointed them with the expectation that the pastor would serve that charge for a minimum of 10 years.
This requires filling appointments of retiring pastors with pastors who will not be expected to retire or move for the next 10-15 years. It requires leaving pastors in their current appointments if they will likely retire in the next decade. It requires patience on the part of the pastor, the local charge, and the bishop when a pastor does not thrive in the early years of an appointment.
Based on the above, I recommend that Annual Conferences set a goal of 10-year average pastoral tenures.
To meet this goal, we would need to make several changes to current practice and understanding.
1. Boards of Ordained Ministry should prepare current and incoming pastors to expect long tenures.
Several current and former members of the appointive cabinet have suggested that most transitions are pastor-initiated. We should help pastors to expect tenures of 10+ years as normative, and to expect only two or three appointments over the course of their time in appointed ministry. Pastors who expect the itinerant system to serve as a system for steady promotions will have to reevaluate their understanding of itineracy’s purpose. Pastors who have used the itinerant system to quickly escape uncomfortable situations will have to learn how to work through difficulties and invest in congregations for their long-term benefit.
The expectation of longer tenures and fewer moves can provide many side benefits to pastors, their families, and their ministries. Harvard professor Robert Putnam observes, “[F]or people as for plants, frequent repotting disrupts root systems. It takes time for a mobile individual to put down new roots […] frequent movers have weaker community ties.”[9] This change in paradigm will be welcome news to many (potential) United Methodist pastors who have been wary of the disruption caused by frequent moves. Greater stability will likely lead to greater health for pastors and their families, stronger community ties for outreach, and better financial security for families of pastors with working spouses.
2. Bishops and their appointive cabinets should make appointments with the expectation that they are appointing for a minimum of ten years.
This will require patience during difficult transitions. As the results above show, even pastors who eventually see worship attendance increases frequently experience losses during their first several years in an appointment. Bishops and cabinets will need to urge congregations and pastors to continue working together, rather than offering an easy exit plan when either side is unhappy.
This will also require bishops and cabinets to resist using the itinerant system as a system for promotions. Pastors will need to remain in the same appointments for long periods of time, so the opportunity to use new appointments for promotions will be rare.
Finally, this could require new strategies for clergy whose churches decline in attendance. Longer tenures will expose clergy who are not able to provide the leadership needed to sustain a larger church. In some of these cases, clergy may lead churches to a point that they can no longer sustain a full-time elder’s compensation. This will require the bishop and appointive cabinet to determine whether it would be appropriate to initiate a part-time appointment (outlined in BOD ¶ 338.2.a.3) or to initiate a process for evaluation of clergy for effectiveness (outlined in BOD ¶ 334).
To move toward these longer expected appointments, appointive cabinets could move to a quadrennial regular appointment cycle. Outside this cycle, appointments would be considered exceptional––to fill voids due to retirement, death, or other unexpected events. This would free congregations and pastors from annual anxiety and conjecture about whether the pastor will be moved.[10]
3. District Superintendents should prepare congregations to expect long tenures.
This will require District Superintendents to have a high level of engagement with congregations during times of pastoral transition. They will need to communicate to congregations that appointments are intended for a long period, and they do not plan to respond to calls for new clergy leadership unless a pastor’s conduct or performance requires formal evaluation.
Because of these expectations for long tenures, a good transition and good fit between pastor and congregation will be imperative. Helping ensure good appointments will become the most critical duty of a District Superintendent. DSs will need to invest significant time and energy in knowing their pastors and congregations, especially in preparation for times of pastoral transition.
As stated above, these recommendations do not reflect the opinions of the Kentucky Annual Conference or the Conference Stats Team. They are only my opinions, based on the results of the current study.
Further Study
This research provides many opportunities for further study. Research above was limited to the Kentucky Annual Conference, churches with 150 AWA or more (for studies #1 and #2), and 2005 – 2015. By changing any of those variables, we could ask the same questions and obtain new results.
Simple next questions: Do other conferences, or even denominations, show the same patterns? Do smaller churches follow these patterns? Have these patterns been similar in earlier times, and will they be similar in the next years and decades?
Appendix 1 – Tenure and Transition in NFL Coaching, a bonus study
The importance of lengthening tenures and limiting transitions applies far beyond the church. A study of current NFL teams (using their ELO rating, as of 11/5/17) also shows a relationship between team strength and leader tenure and transitions.[11]
As with pastoral tenures, we may note that this is a two-way relationship. Success is likely to lead to longer tenures. But a comparison of the top 25%, second 25%, third 25%, and bottom 25% of all NFL teams shows a steady decline in median coaching tenure and a general increase in leadership transitions over the past 15 years. Median tenure of coaches in the top 25% is four times as long as the median tenure of bottom 25% teams.
With short tenures and frequent transitions, teams are unlikely to develop a stable and healthy culture. Though the head coach is not the only leader, he is the person in charge, and his consistent presence has a significant effect. Likewise, though the senior pastor should not be the only leader in a church, (s)he is the pastor in charge and has a significant effect on the stability and health of a church’s culture.


[1] Members: Teddy Ray, Paul Brunstetter, Tami Coleman, Chad Foster, Paul Frederick, Todd Nelson, Greg Survant
[2] Most studies below are for 2005 – 2015. Our team did not have access to reliable data for earlier years.
[3] Example: Gary Ball was appointed to Crestwood UMC in July 2006. 2006 was recorded as “transition,” 2007 as year 1, 2008 as year 2, and 2009 as another transition year, as the church received a new senior pastor in July 2009.
Crestwood UMC’s reported AWA increased by 8.5% in 2006, then decreased by 9.5%, 6%, and 9.8% in the following years. Changes for those years were recorded:
Transition: +8.5%
Year 1: -9.5%
Year 2: -6%
Transition: -9.8%
[4] Technically, this is an appointment to a 4th year, since our methodology counted the first appointment year as “transition.”
[5] Churches under 150 in AWA were not studied due to time constraints. We also felt the statistics for these churches were less reliable, since reporting has not been as consistent for smaller churches.
[6] These numbers only represent full elders. They do not account for a large number of licensed local pastors, provisional elders, or other clergy designations. The study intends to recognize different patterns in appointment-making across different districts. Though these numbers do not reflect all clergy, they serve as representative about appointment decisions in each district.
[7] Another 13 pastors were serving in 10th+ year of appointment in an associate role.
[8] By calculating professions of faith / 100 AWA, we normalize professions of faith for all church sizes.
[9] In Bowling Alone: The Collapse and Revival of American Community (New York: Simon & Schuster, 2000), 205.
[10] Thanks to Rev. Chad Bowen for this suggestion.
[11] My Bengals appear to be a sad exception.
 Look at that beautiful direct relationship. More churches = more people in worship.
 No relationship. The correlation is -0.12. This doesn’t change significantly even if we separate our counties by size. Even among our large counties––where churches are likely to grow larger––the number of churches per capita relates to how many people we’re reaching, the average size of the churches in that county does not.
 When we look at our merger products, we see more evidence that our bigger is better thinking is flawed. Analysis of Kentucky’s merger product churches over the past decade shows them as the single worst-performing category of churches we found. We had eleven merger product churches. Nine declined in their combined attendance and averaged a 33% loss. Five of them were among our top 20 attendance decreases across the conference during this period. (A category of churches that makes up only 1.4% of the Conference represented 25% of our churches with worst worship attendance losses.)